
Why Parent Advisory Committees Matter in Child Care
2 min read
Jul 9, 2025
Family
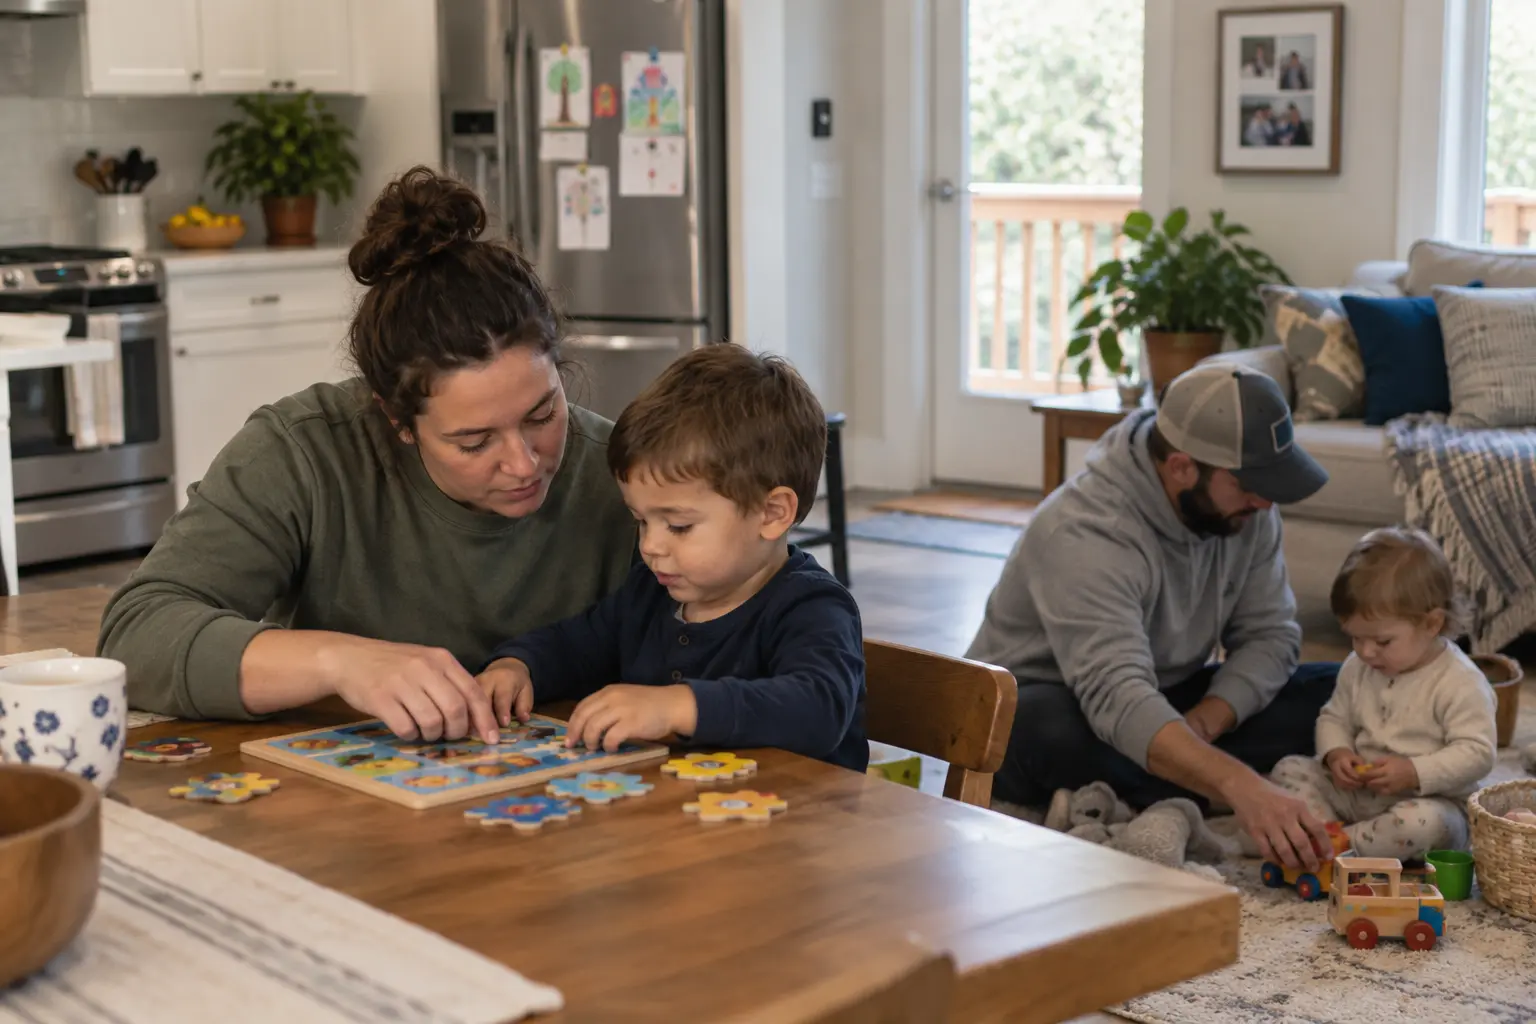
The quality of early care and education matters more when children spend less time learning, talking, and playing at home. On an average day, fewer adults in the U.S. now spend time caring for household children than they did a decade ago. Among those who still do, the time spent on some activities is getting shorter, while a smaller group of caregivers is packing more into the time they have.
The practical impacts of these shifts do not stay inside the home. The way parents spend time with – or without – their children can shape how much educational support needs to happen inside the classroom, how children regulate emotions in child care settings, and how families use paid care. Over time, these patterns can also feed through to demand and enrollment.
To measure the change, Playground analyzed American Time Use Survey data from the U.S. Bureau of Labor Statistics, comparing how adults in 2025 with 2019, and 2015 spent their time with household children.
The figures below describe the civilian population on an average day: the share of people who spent any time in each activity, and how long those who did the activity spent on it.
Looking for ways to spend less time on administration and more time on child development? Book a free demo with Playground to learn more.
Fewer adults spend time caring for household children than a decade ago. On an average day in 2025, 17.3% of people cared for or helped household children, down from 20.7% in 2015. The drop shows up for both women (25.6% to 20.8%) and men (15.6% to 13.5%). That can reflect fewer households with children, more care happening outside the home, or both. The adults who still provide that care are spending slightly more time doing it. People who did spend time caring for household children in an average day in 2025 spent 2.09 hours on it, up from 1.91 hours in 2015.
Fewer people are reading to and talking with children at home. 2.1% of adults spent time reading to or with household children on an average day in 2025, down from 2.7% in 2019. Among those who did, time spent rose from 0.44 hours to 0.52 hours. Talking and listening follow the same pattern, with 2.5% of adults taking part in discussions with household children in 2025, down from 2.8% in 2019. Time among those who did participate in this activity rose from 0.55 hours to 0.64 hours.
Family play at home is both less common and shorter. On an average day, 4.7% of people played with household children in 2025 – not including time spent on sports – down from 5.1% in 2019. Those who did play with household children spent an average of 1.59 hours doing so, down from 1.74 hours in 2019.
The prevalence of caring for other people’s children has been halved. 2.3% of people cared for or helped nonhousehold children in 2025, exactly half the 4.6% share in 2015. These remaining communal caregivers spend more time doing it than in the past: 1.97 hours per day on average, up from 1.36 hours over the same timeframe.
Education support at home is becoming more concentrated than it was 10 years ago. 2.5% of people spent time on household children’s education in 2025, down from 3.6% in 2015. However – like with reading – the average number of hours spent on this activity increased from 1.01 hours in 2015 to 1.22 hours in 2025. While data as far back as 2015 wasn’t available for this metric, participation in homework help also declined from an average of 2.6% of people per day in 2019 to 2.0% in 2025, while the hours spent increased from 0.76 hours to 0.91 hours. This opens up the possibility of a wider spread among children’s preparedness for child care settings and related developmental tasks.
Women still do these child-care tasks more often than men, but men spend longer on some of them. Women who provided household child care still spent more time overall at 2.29 hours versus 1.76 hours for men. However, this trend is not consistent across all activities with household children. While women remain far more likely to participate in education- and language-related activities, men who participated in tasks like talking and listening (0.81 hours versus 0.57 hours), helping with homework (0.96 versus 0.88 hours), and caring for nonhousehold children (2.02 versus 1.94 hours) spent a longer time on the activities than women did on average.
Percent of people who did the activity on an average day, and hours spent by those who did it.
2025 | 2019 | 2015 | ||||
Activity | Average percent engaged in the activity per day | Average hours per day for people who engaged in the activity | Average percent engaged in the activity per day | Average hours per day for persons who engaged in the activity | Average percent engaged in the activity per day | Average hours per day for persons who engaged in the activity |
Caring for and helping household children | 17.3 | 2.09 | 19 | 1.92 | 20.7 | 1.91 |
Caring for and helping household children (except activities related to education and health) | 16.7 | 1.93 | 18.6 | 1.74 | 20.3 | 1.72 |
Physical care for household children | 12.7 | 1.16 | 13 | 1.02 | NA | NA |
Reading to and with household children | 2.1 | 0.52 | 2.7 | 0.44 | NA | NA |
Talking with and listening to household children | 2.5 | 0.64 | 2.8 | 0.55 | NA | NA |
Playing with household children, not sports | 4.7 | 1.59 | 5.1 | 1.74 | NA | NA |
Attending household children’s events | 0.9 | 1.81 | 1.1 | 1.81 | NA | NA |
Activities related to household children’s education | 2.5 | 1.22 | 3.1 | 0.93 | 3.6 | 1.01 |
Helping household children with homework | 2 | 0.91 | 2.6 | 0.76 | NA | NA |
Activities related to household children’s health | 0.7 | 0.97 | 0.9 | 1.49 | 0.9 | 1.03 |
Caring for and helping nonhousehold children | 2.3 | 1.97 | 3.7 | 1.84 | 4.6 | 1.36 |
It’s important to note that these are population averages, and don’t necessarily reflect the trends in your locale. But this information can still have operational consequences.
Classroom time is covering more developmental ground. If reading, conversation, and play are less common at home, the value of a strong, consistent ECE day goes up. So does the cost of a weak one.
Enrollment pressure can rise even when birth rates fall. A smaller share of adults caring for children at home, and half as many adults caring for other people’s children, leaves more families looking for a formal arrangement. Demand is not only a function of how many children exist. It is also a function of who else is available on a Tuesday afternoon.Family engagement may need to change shape. The families still reading and talking at home are spending more minutes when they do. Programs that send books home, model talk, or build short, repeatable routines are working with that concentrated group. The larger challenge is reaching the households that no longer show up in these activities at all. Staffing and curriculum quality are part of the same story. If more learning and regulation work is happening at school instead of at home, teachers need time, coaching, and ratios that make that possible. The data does not measure program quality. It does show why quality is harder to treat as optional.
Figures come from the U.S. Bureau of Labor Statistics American Time Use Survey (ATUS) for 2025, 2019, and 2015.
ATUS measures primary activities: what a person was doing as their main activity. Secondary childcare – watching a child while cooking, working, or watching television – is not included here. That means these numbers understate the total time children are “with” an adult, and they are best read as a measure of dedicated care, play, reading, talk, and school support.
Estimates are for the civilian population, not only parents. A decline in the share of people caring for household children can therefore come from a smaller share of households with children, from parents spending fewer days in these activities, or from both. Hours among participants are the better measure of intensity among people who actually did the activity that day.
Some detailed 2015 estimates were not available.
The quality of early care and education matters more when children spend less time learning, talking, and playing at home. On an average day, fewer adults in the U.S. now spend time caring for household children than they did a decade ago. Among those who still do, the time spent on some activities is getting shorter, while a smaller group of caregivers is packing more into the time they have.
The practical impacts of these shifts do not stay inside the home. The way parents spend time with – or without – their children can shape how much educational support needs to happen inside the classroom, how children regulate emotions in child care settings, and how families use paid care. Over time, these patterns can also feed through to demand and enrollment.
To measure the change, Playground analyzed American Time Use Survey data from the U.S. Bureau of Labor Statistics, comparing how adults in 2025 with 2019, and 2015 spent their time with household children.
The figures below describe the civilian population on an average day: the share of people who spent any time in each activity, and how long those who did the activity spent on it.
Looking for ways to spend less time on administration and more time on child development? Book a free demo with Playground to learn more.
Fewer adults spend time caring for household children than a decade ago. On an average day in 2025, 17.3% of people cared for or helped household children, down from 20.7% in 2015. The drop shows up for both women (25.6% to 20.8%) and men (15.6% to 13.5%). That can reflect fewer households with children, more care happening outside the home, or both. The adults who still provide that care are spending slightly more time doing it. People who did spend time caring for household children in an average day in 2025 spent 2.09 hours on it, up from 1.91 hours in 2015.
Fewer people are reading to and talking with children at home. 2.1% of adults spent time reading to or with household children on an average day in 2025, down from 2.7% in 2019. Among those who did, time spent rose from 0.44 hours to 0.52 hours. Talking and listening follow the same pattern, with 2.5% of adults taking part in discussions with household children in 2025, down from 2.8% in 2019. Time among those who did participate in this activity rose from 0.55 hours to 0.64 hours.
Family play at home is both less common and shorter. On an average day, 4.7% of people played with household children in 2025 – not including time spent on sports – down from 5.1% in 2019. Those who did play with household children spent an average of 1.59 hours doing so, down from 1.74 hours in 2019.
The prevalence of caring for other people’s children has been halved. 2.3% of people cared for or helped nonhousehold children in 2025, exactly half the 4.6% share in 2015. These remaining communal caregivers spend more time doing it than in the past: 1.97 hours per day on average, up from 1.36 hours over the same timeframe.
Education support at home is becoming more concentrated than it was 10 years ago. 2.5% of people spent time on household children’s education in 2025, down from 3.6% in 2015. However – like with reading – the average number of hours spent on this activity increased from 1.01 hours in 2015 to 1.22 hours in 2025. While data as far back as 2015 wasn’t available for this metric, participation in homework help also declined from an average of 2.6% of people per day in 2019 to 2.0% in 2025, while the hours spent increased from 0.76 hours to 0.91 hours. This opens up the possibility of a wider spread among children’s preparedness for child care settings and related developmental tasks.
Women still do these child-care tasks more often than men, but men spend longer on some of them. Women who provided household child care still spent more time overall at 2.29 hours versus 1.76 hours for men. However, this trend is not consistent across all activities with household children. While women remain far more likely to participate in education- and language-related activities, men who participated in tasks like talking and listening (0.81 hours versus 0.57 hours), helping with homework (0.96 versus 0.88 hours), and caring for nonhousehold children (2.02 versus 1.94 hours) spent a longer time on the activities than women did on average.
Percent of people who did the activity on an average day, and hours spent by those who did it.
2025 | 2019 | 2015 | ||||
Activity | Average percent engaged in the activity per day | Average hours per day for people who engaged in the activity | Average percent engaged in the activity per day | Average hours per day for persons who engaged in the activity | Average percent engaged in the activity per day | Average hours per day for persons who engaged in the activity |
Caring for and helping household children | 17.3 | 2.09 | 19 | 1.92 | 20.7 | 1.91 |
Caring for and helping household children (except activities related to education and health) | 16.7 | 1.93 | 18.6 | 1.74 | 20.3 | 1.72 |
Physical care for household children | 12.7 | 1.16 | 13 | 1.02 | NA | NA |
Reading to and with household children | 2.1 | 0.52 | 2.7 | 0.44 | NA | NA |
Talking with and listening to household children | 2.5 | 0.64 | 2.8 | 0.55 | NA | NA |
Playing with household children, not sports | 4.7 | 1.59 | 5.1 | 1.74 | NA | NA |
Attending household children’s events | 0.9 | 1.81 | 1.1 | 1.81 | NA | NA |
Activities related to household children’s education | 2.5 | 1.22 | 3.1 | 0.93 | 3.6 | 1.01 |
Helping household children with homework | 2 | 0.91 | 2.6 | 0.76 | NA | NA |
Activities related to household children’s health | 0.7 | 0.97 | 0.9 | 1.49 | 0.9 | 1.03 |
Caring for and helping nonhousehold children | 2.3 | 1.97 | 3.7 | 1.84 | 4.6 | 1.36 |
It’s important to note that these are population averages, and don’t necessarily reflect the trends in your locale. But this information can still have operational consequences.
Classroom time is covering more developmental ground. If reading, conversation, and play are less common at home, the value of a strong, consistent ECE day goes up. So does the cost of a weak one.
Enrollment pressure can rise even when birth rates fall. A smaller share of adults caring for children at home, and half as many adults caring for other people’s children, leaves more families looking for a formal arrangement. Demand is not only a function of how many children exist. It is also a function of who else is available on a Tuesday afternoon.Family engagement may need to change shape. The families still reading and talking at home are spending more minutes when they do. Programs that send books home, model talk, or build short, repeatable routines are working with that concentrated group. The larger challenge is reaching the households that no longer show up in these activities at all. Staffing and curriculum quality are part of the same story. If more learning and regulation work is happening at school instead of at home, teachers need time, coaching, and ratios that make that possible. The data does not measure program quality. It does show why quality is harder to treat as optional.
Figures come from the U.S. Bureau of Labor Statistics American Time Use Survey (ATUS) for 2025, 2019, and 2015.
ATUS measures primary activities: what a person was doing as their main activity. Secondary childcare – watching a child while cooking, working, or watching television – is not included here. That means these numbers understate the total time children are “with” an adult, and they are best read as a measure of dedicated care, play, reading, talk, and school support.
Estimates are for the civilian population, not only parents. A decline in the share of people caring for household children can therefore come from a smaller share of households with children, from parents spending fewer days in these activities, or from both. Hours among participants are the better measure of intensity among people who actually did the activity that day.
Some detailed 2015 estimates were not available.

Jaclyn DeJohn, CFP®
Director of Content
Jaclyn is a data journalist and CFP™ who evaluates trends in the childcare industry and wider economy. She has previously worked for publications including CNET, SmartAsset, Bizfluent, AZCentral and Chron, and as a research consultant for NAPCO Media. Her insights are often cited by publications including Bloomberg, CNBC, Business Insider, Fox News, USA Today, The Hill and more. She has a bachelor’s degree in economics and mathematics from The College of New Jersey.
Date created

Nick Caughell
The Weston School
of directors say Playground saves them hours every week
Based on data from 5,000+ centers.