

CACFP Reimbursement Rates Updated for July 1, 2026 – June 30, 2027
CACFP Reimbursement Rates Updated for July 1, 2026 – June 30, 2027
CACFP Reimbursement Rates Updated for July 1, 2026 – June 30, 2027

Last updated:
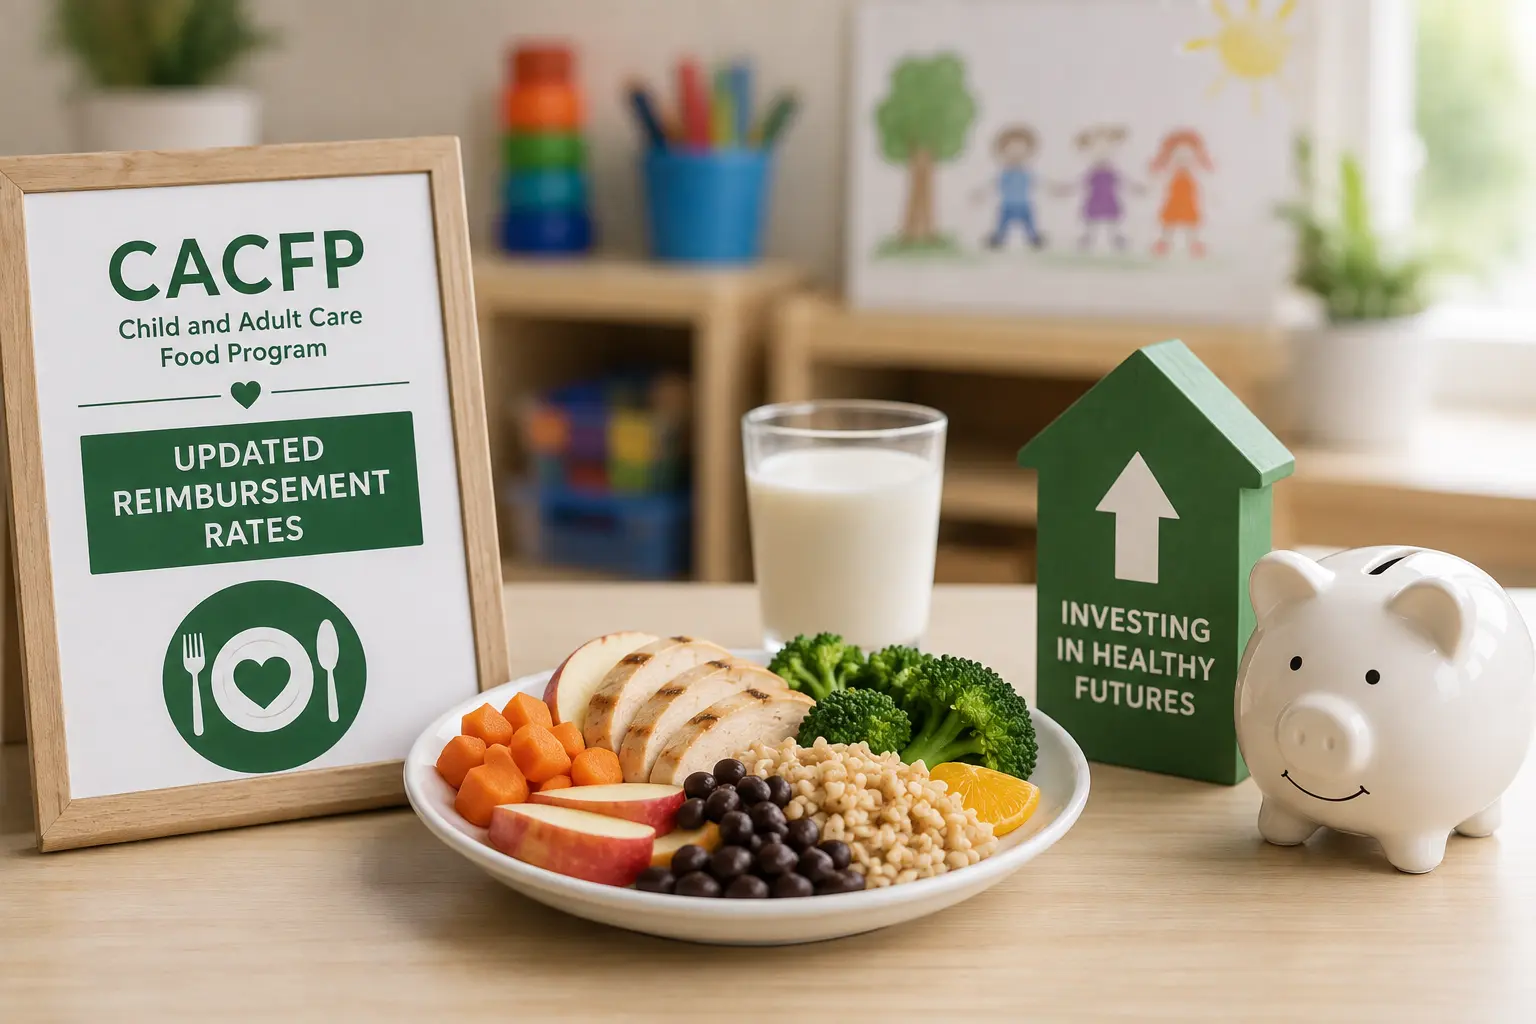
The U.S. Department of Agriculture has released the annual adjusted payment rates for the Child and Adult Care Food Program (CACFP), commonly known as the Food Program. These rates are effective July 1, 2026, through June 30, 2027.
In summary, the adjustments reflect Consumer Price Index changes based on the basket of consumer goods that most accurately reflects the center type, as follows:
Centers: +3.54% (Food Away From Home series)
Day care homes: +2.74% (Food At Home series)
Administrative rates for home sponsors: +4.25% (All Items series)
The updated rates for various program types and reimbursement rates reflect these changes and are listed below, rounded down to the nearest whole cent. Note that higher rates only translate into more funding if meals are correctly planned and accurately reported. Many providers still leave money on the table through simple tracking mistakes – more on that below.
Looking for a compliant way to automate your Food Program and subsidy reporting? Book a free demo with Playground to learn more.
Some technical notes on reimbursement rates
In addition to cash reimbursement for meals, the USDA offers participating child care centers the option of receiving additional USDA Foods or cash-in-lieu (CIL) of the additional foods. These are provided at an annually adjusted per meal rate for each lunch and supper served.
The rates below do not include the value of USDA Foods or cash-in-lieu of USDA Foods, which are currently set at an additional $0.32 per lunch or supper.
Higher reimbursement rates apply in Alaska, Guam, Hawaii, Puerto Rico, and the U.S. Virgin Islands, and so they are broken out with separate rate tables. The District of Columbia uses contiguous-state rates.
Reimbursement values for each category generally come in various rates depending on the income of the subject family or other factors. For instance, reimbursement rates for centers come in three forms: Free, Reduced-price, and Paid rates. For home-based providers, reimbursement rates are offered at the Tier I and Tier II levels.
1. National average CACFP payment rates for centers
The following rates apply to child care centers, as well as outside-school-hours care centers, at-risk afterschool care centers, and adult day care centers.
Key increases (contiguous states) | Free rate | Reduced rate | Paid rate |
Breakfast | +$0.08 | +$0.08 | +$0.02 |
Lunch / supper | +$0.16 | +$0.16 | +$0.01 |
Snack | +$0.04 | +$0.02 | +$0.01 |
Contiguous states (and D.C.)
Meal Type | Free | Reduced-Price | Paid |
Breakfast | $2.54 | $2.24 | $0.42 |
Lunch / Supper | $4.76 | $4.36 | $0.45 |
Snack | $1.30 | $0.65 | $0.12 |
Alaska
Meal Type | Free | Reduced-Price | Paid |
Breakfast | $4.09 | $3.79 | $0.64 |
Lunch / Supper | $7.72 | $7.32 | $0.74 |
Snack | $2.12 | $1.06 | $0.19 |
Guam, Hawaii, Puerto Rico & Virgin Islands
Meal Type | Free | Reduced-Price | Paid |
Breakfast | $3.29 | $2.99 | $0.52 |
Lunch / Supper | $6.19 | $5.79 | $0.59 |
Snack | $1.70 | $0.85 | $0.15 |
2. Food service payment rates for child care homes
Key increases (contiguous states) | Tier I | Tier II |
Breakfast | +$0.04 | +$0.01 |
Lunch / supper | +$0.09 | +$0.05 |
Snack | +$0.02 | +$0.01 |
Contiguous states (and D.C.)
Meal Type | Tier I | Tier II |
Breakfast | $1.74 | $0.62 |
Lunch / Supper | $3.31 | $1.99 |
Snack | $0.98 | $0.27 |
Alaska
Meal Type | Tier I | Tier II |
Breakfast | $2.79 | $0.98 |
Lunch / Supper | $5.36 | $3.23 |
Snack | $1.59 | $0.44 |
Guam, Hawaii, Puerto Rico & Virgin Islands
Meal Type | Tier I | Tier II |
Breakfast | $2.25 | $0.79 |
Lunch / Supper | $4.30 | $2.59 |
Snack | $1.28 | $0.35 |
3. Administrative reimbursement rates for sponsoring organizations of child care homes
Monthly rates per sponsored home.
Category | Contiguous states | Alaska | Guam, Hawaii, PR & VI |
Initial 50 homes | $157 | $254 | $204 |
Next 150 homes | $119 | $193 | $155 |
Next 800 homes | $93 | $151 | $121 |
Each additional home | $82 | $133 | $107 |
Maximizing the new rates: Accurate reporting matters
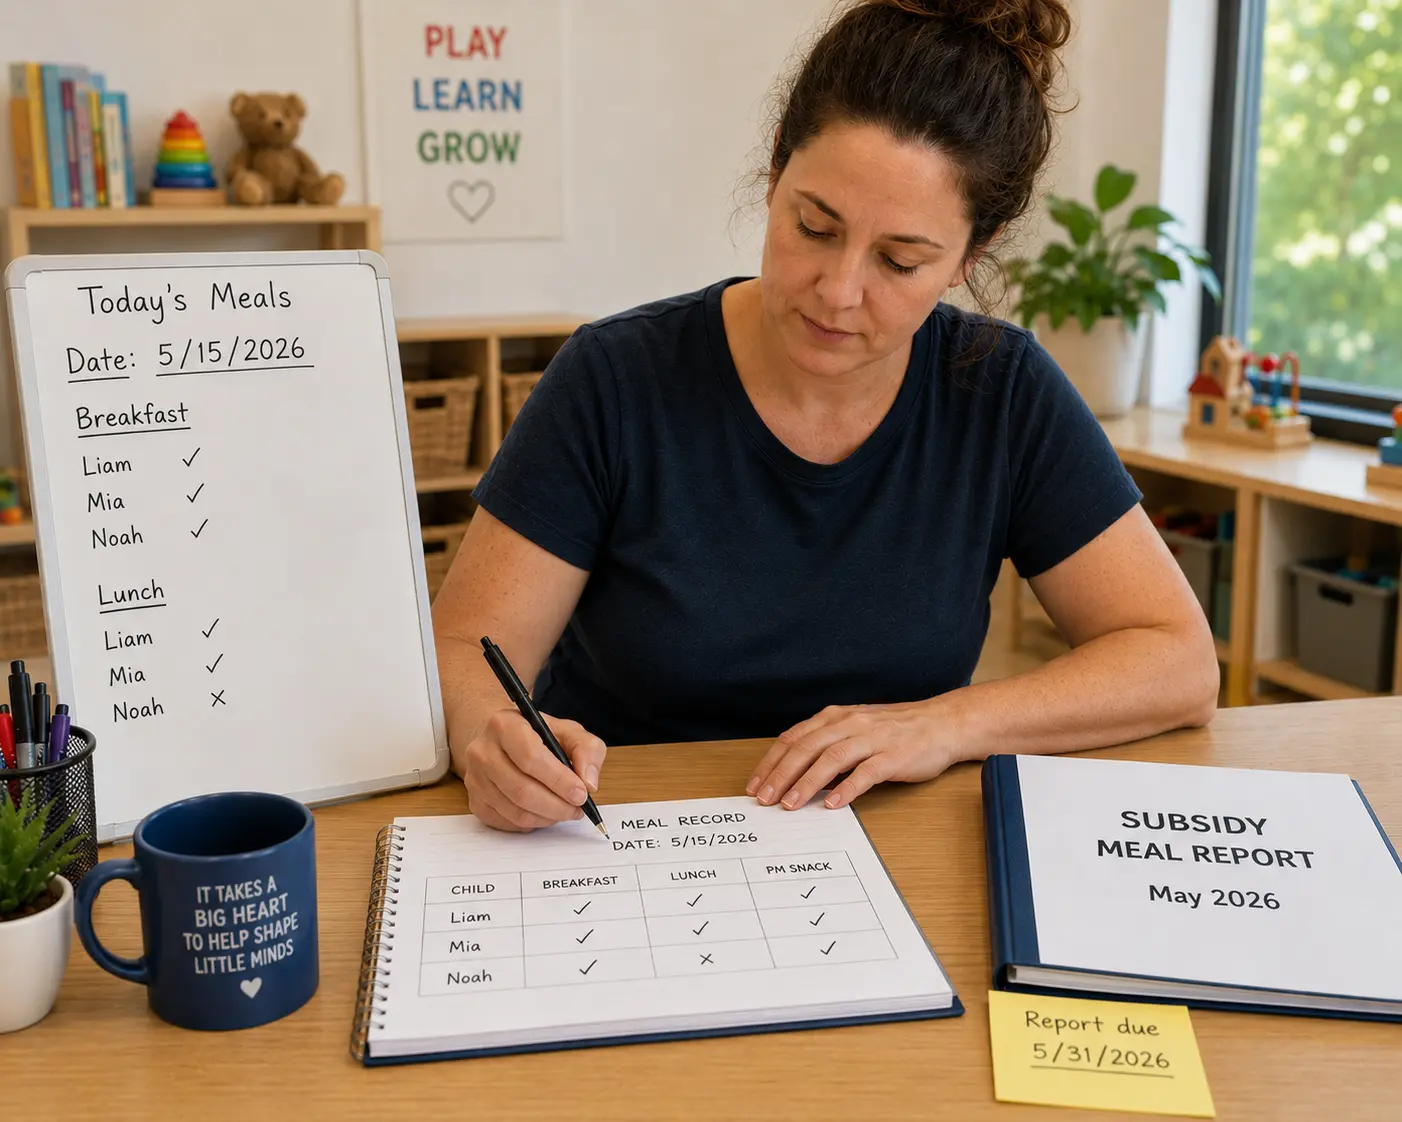
Even with these increases, many child care providers still miss out on reimbursements because of manual meal-tracking errors. A recent analysis found that center-based providers participating in the Food Program lose an average of $28.88 to $210.75 per child per year due to manual reporting errors, while home-based providers lose $56.55–$148.85 per child per year.
Scaled up, a center with 100 free-rate children can leave more than $21,000 unclaimed annually.
Switching to automated systems that calculate reimbursements by child, flag discrepancies, and maintain clean audit trails is one of the most effective ways to stop leaving money on the table.
Consider using Playground to automate your reporting to save time and capture all the reimbursements you’re eligible for. Book a custom demo at a time that’s convenient for you.
Serving meals that actually qualify
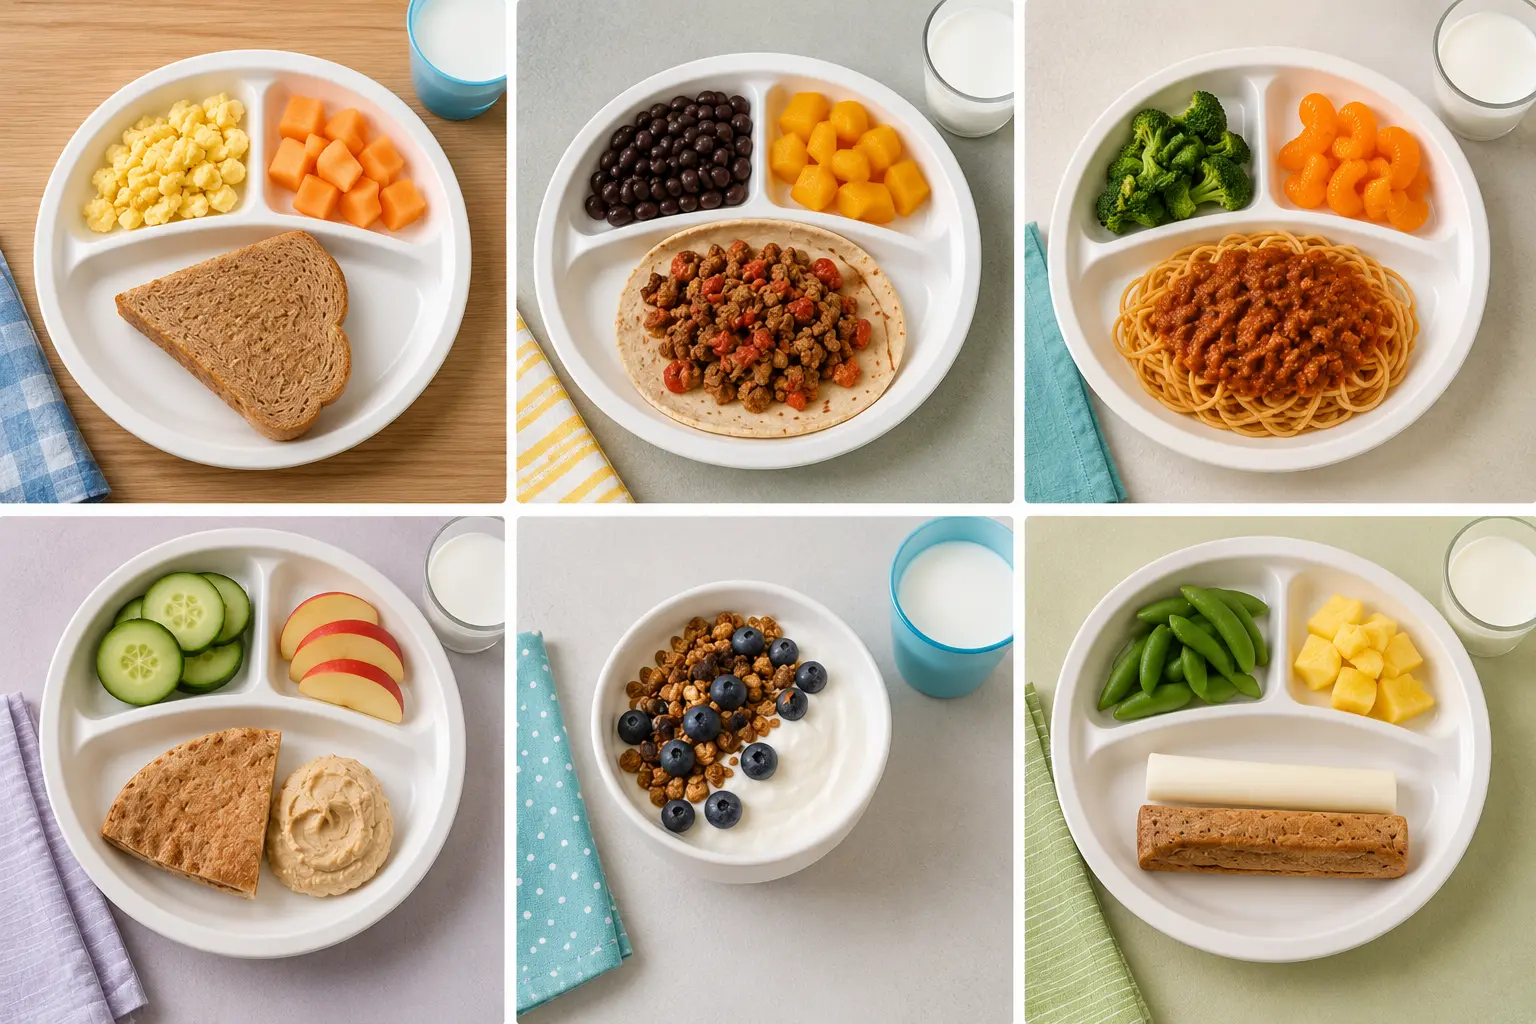
Higher rates only apply when meals meet CACFP component requirements (milk, grains, vegetables, fruits, and meat/meat alternates) for the child’s age group. Practical, ready-to-use ideas that stay fully compliant for infants through preschoolers can make daily planning much easier—think banana oatmeal bowls, chicken-and-rice plates with soft vegetables, or simple cheese-and-fruit snacks, all portioned correctly for 1–2-year-olds or 3–5-year-olds.
You can find a full set of age-specific breakfast, lunch/supper, and snack ideas here: CACFP Meal Ideas by Age.
One-stop Food Program resource for 2026–2027
For a single place that pulls together the new rates, compliant meal ideas, the reporting-error study, and additional tools for tracking and claiming, visit Playground’s comprehensive CACFP resource hub: tryplayground.com/resources/cacfp.
Otherwise, you can book a free demo with Playground to learn more about automating your Food Program reporting and more.
The U.S. Department of Agriculture has released the annual adjusted payment rates for the Child and Adult Care Food Program (CACFP), commonly known as the Food Program. These rates are effective July 1, 2026, through June 30, 2027.
In summary, the adjustments reflect Consumer Price Index changes based on the basket of consumer goods that most accurately reflects the center type, as follows:
Centers: +3.54% (Food Away From Home series)
Day care homes: +2.74% (Food At Home series)
Administrative rates for home sponsors: +4.25% (All Items series)
The updated rates for various program types and reimbursement rates reflect these changes and are listed below, rounded down to the nearest whole cent. Note that higher rates only translate into more funding if meals are correctly planned and accurately reported. Many providers still leave money on the table through simple tracking mistakes – more on that below.
Looking for a compliant way to automate your Food Program and subsidy reporting? Book a free demo with Playground to learn more.
Some technical notes on reimbursement rates
In addition to cash reimbursement for meals, the USDA offers participating child care centers the option of receiving additional USDA Foods or cash-in-lieu (CIL) of the additional foods. These are provided at an annually adjusted per meal rate for each lunch and supper served.
The rates below do not include the value of USDA Foods or cash-in-lieu of USDA Foods, which are currently set at an additional $0.32 per lunch or supper.
Higher reimbursement rates apply in Alaska, Guam, Hawaii, Puerto Rico, and the U.S. Virgin Islands, and so they are broken out with separate rate tables. The District of Columbia uses contiguous-state rates.
Reimbursement values for each category generally come in various rates depending on the income of the subject family or other factors. For instance, reimbursement rates for centers come in three forms: Free, Reduced-price, and Paid rates. For home-based providers, reimbursement rates are offered at the Tier I and Tier II levels.
1. National average CACFP payment rates for centers
The following rates apply to child care centers, as well as outside-school-hours care centers, at-risk afterschool care centers, and adult day care centers.
Key increases (contiguous states) | Free rate | Reduced rate | Paid rate |
Breakfast | +$0.08 | +$0.08 | +$0.02 |
Lunch / supper | +$0.16 | +$0.16 | +$0.01 |
Snack | +$0.04 | +$0.02 | +$0.01 |
Contiguous states (and D.C.)
Meal Type | Free | Reduced-Price | Paid |
Breakfast | $2.54 | $2.24 | $0.42 |
Lunch / Supper | $4.76 | $4.36 | $0.45 |
Snack | $1.30 | $0.65 | $0.12 |
Alaska
Meal Type | Free | Reduced-Price | Paid |
Breakfast | $4.09 | $3.79 | $0.64 |
Lunch / Supper | $7.72 | $7.32 | $0.74 |
Snack | $2.12 | $1.06 | $0.19 |
Guam, Hawaii, Puerto Rico & Virgin Islands
Meal Type | Free | Reduced-Price | Paid |
Breakfast | $3.29 | $2.99 | $0.52 |
Lunch / Supper | $6.19 | $5.79 | $0.59 |
Snack | $1.70 | $0.85 | $0.15 |
2. Food service payment rates for child care homes
Key increases (contiguous states) | Tier I | Tier II |
Breakfast | +$0.04 | +$0.01 |
Lunch / supper | +$0.09 | +$0.05 |
Snack | +$0.02 | +$0.01 |
Contiguous states (and D.C.)
Meal Type | Tier I | Tier II |
Breakfast | $1.74 | $0.62 |
Lunch / Supper | $3.31 | $1.99 |
Snack | $0.98 | $0.27 |
Alaska
Meal Type | Tier I | Tier II |
Breakfast | $2.79 | $0.98 |
Lunch / Supper | $5.36 | $3.23 |
Snack | $1.59 | $0.44 |
Guam, Hawaii, Puerto Rico & Virgin Islands
Meal Type | Tier I | Tier II |
Breakfast | $2.25 | $0.79 |
Lunch / Supper | $4.30 | $2.59 |
Snack | $1.28 | $0.35 |
3. Administrative reimbursement rates for sponsoring organizations of child care homes
Monthly rates per sponsored home.
Category | Contiguous states | Alaska | Guam, Hawaii, PR & VI |
Initial 50 homes | $157 | $254 | $204 |
Next 150 homes | $119 | $193 | $155 |
Next 800 homes | $93 | $151 | $121 |
Each additional home | $82 | $133 | $107 |
Maximizing the new rates: Accurate reporting matters
Even with these increases, many child care providers still miss out on reimbursements because of manual meal-tracking errors. A recent analysis found that center-based providers participating in the Food Program lose an average of $28.88 to $210.75 per child per year due to manual reporting errors, while home-based providers lose $56.55–$148.85 per child per year.
Scaled up, a center with 100 free-rate children can leave more than $21,000 unclaimed annually.
Switching to automated systems that calculate reimbursements by child, flag discrepancies, and maintain clean audit trails is one of the most effective ways to stop leaving money on the table.
Consider using Playground to automate your reporting to save time and capture all the reimbursements you’re eligible for. Book a custom demo at a time that’s convenient for you.
Serving meals that actually qualify
Higher rates only apply when meals meet CACFP component requirements (milk, grains, vegetables, fruits, and meat/meat alternates) for the child’s age group. Practical, ready-to-use ideas that stay fully compliant for infants through preschoolers can make daily planning much easier—think banana oatmeal bowls, chicken-and-rice plates with soft vegetables, or simple cheese-and-fruit snacks, all portioned correctly for 1–2-year-olds or 3–5-year-olds.
You can find a full set of age-specific breakfast, lunch/supper, and snack ideas here: CACFP Meal Ideas by Age.
One-stop Food Program resource for 2026–2027
For a single place that pulls together the new rates, compliant meal ideas, the reporting-error study, and additional tools for tracking and claiming, visit Playground’s comprehensive CACFP resource hub: tryplayground.com/resources/cacfp.
Otherwise, you can book a free demo with Playground to learn more about automating your Food Program reporting and more.
Jaclyn is a data journalist and CFP™ who evaluates trends in the childcare industry and wider economy. She has previously worked for publications including CNET, SmartAsset, Bizfluent, AZCentral and Chron, and as a research consultant for NAPCO Media. Her insights are often cited by publications including Bloomberg, CNBC, Business Insider, Fox News, USA Today, The Hill and more. She has a bachelor’s degree in economics and mathematics from The College of New Jersey.
Share this article
The highest rated child care software
Ratings and review counts from public app store listings, May 2026.


Book a demo and simplify every corner of your business.




Book a demo and simplify every corner of your business.
